非負値行列分解で画像圧縮
非負値行列因子分解というものがある。 Non-negative matrix factorization、NMFとよばれる。
Lee and Seung, nature 1999
http://www.columbia.edu/~jwp2128/Teaching/E4903/papers/nmf_nature.pdf
そもそも行列分解というのは、任意の行列に対して
しばしば低ランク性を仮定して、2つの行列
の積で近似しようというもの。
分解の仕方はいろいろあるが、特異値分解(SVD)がたぶん有名なやつ。主成分分析(PCA)と本質的には同じ。
コスト関数はいろいろあるけど、VとWHの差のフロベニウスノルム。 (ベイズ的解釈でpriorに何選ぶかが関係しているが、それはまた別の記事で)
で、非負値行列分解とは、の要素がそもそも非負ってわかってるなら、
分解するときにその制約入れたほうが良いよねという発想。だから非負値っていう。そのままやな。つまり上記の場合は以下の最小化問題を解くことになる。
となる。
アルゴリズムはいろいろあるらしいが簡単なやつがあって、 Multiplicative update rulesって呼ばれるアルゴリズムが下記論文で提案されたうちの一つ。
Daniel D. Lee, H. Sebastian Seung, Algorithms for Non-negative Matrix Factorization, NIPS2000
https://papers.nips.cc/paper/1861-algorithms-for-non-negative-matrix-factorization
乗法更新法の更新則は以下(上記論文の式(4))。これを適当な回数イテレートすればオッケ。


上記をnumpyで愚直に実装しmnistの画像を圧縮してみた。コードは最後にはりつけた。
ちなみに、現在mldata.orgの鯖が落ちてるらしいので、 以下のように直接ダウンロードしてfetch_mldataのfetch先をローカルキャッシュしておく*1。
$ mkdir -p ~/scikit_learn_data/mldata && cd $_
$ wget https://github.com/amplab/datascience-sp14/raw/master/lab7/mldata/mnist-original.mat
参考
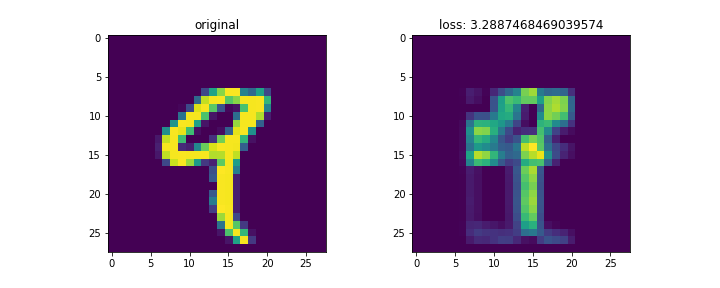
結果は以下。
mnistは28x28の画像。これをランク3で分解して再構成した。
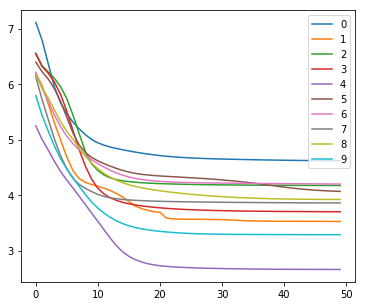
左列が元画像、右列が復元画像。末尾の画像はイテレーションに対する数字別のロスの変化。
画像によってnnz数が異なるため、画像ごとのロスを単純に比較するのはあまり意味がないと思われる。
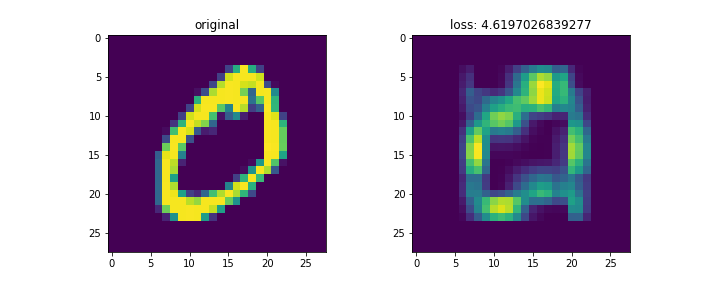
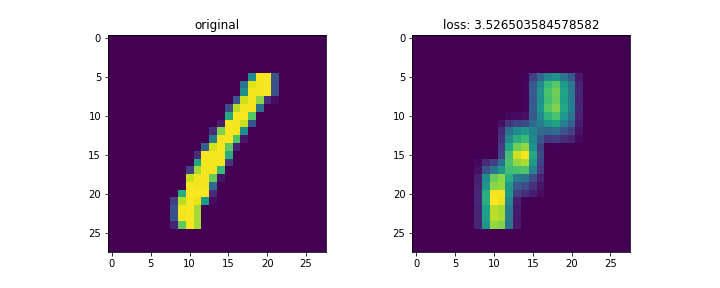
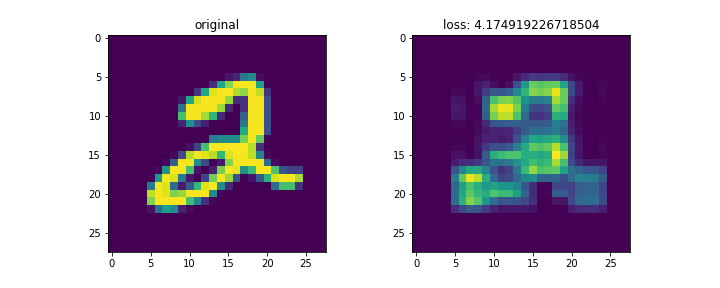
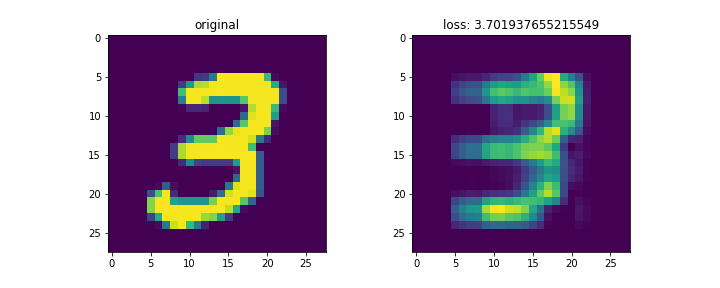
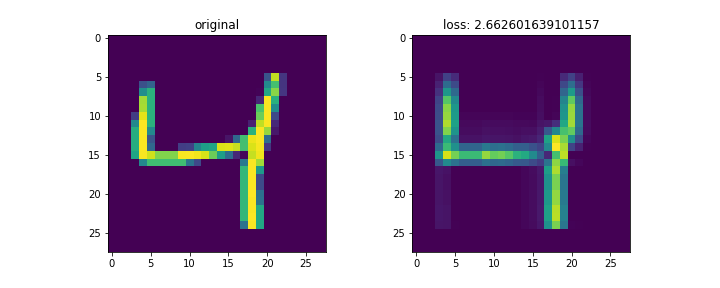

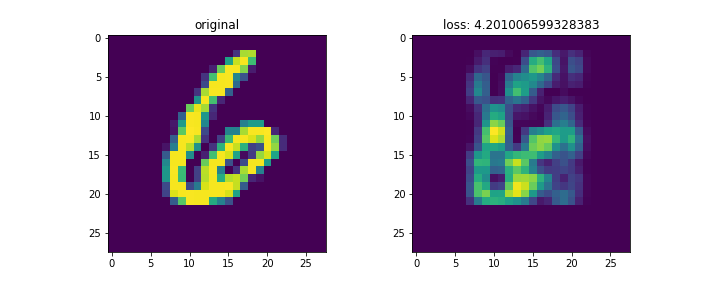
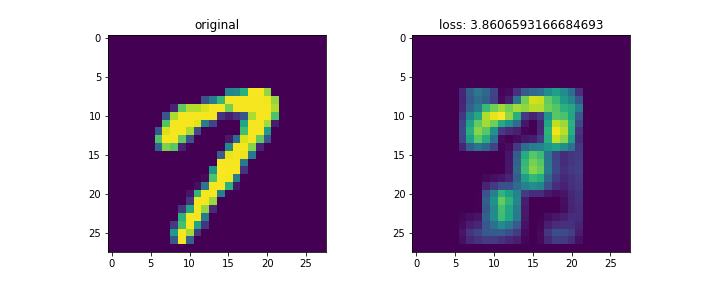
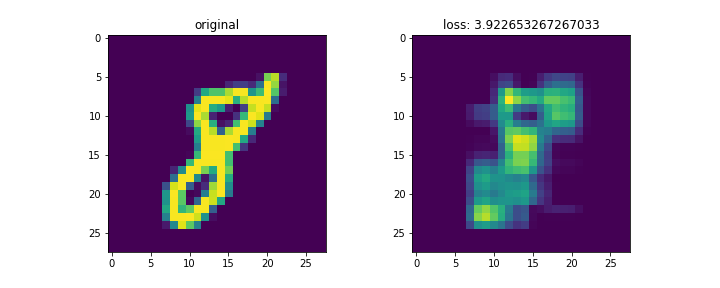
コードは以下。
import numpy as np
from sklearn.datasets import fetch_mldata
import matplotlib.pyplot as plt

mnist = fetch_mldata('MNIST original')
X, y = mnist.data, mnist.target
X = X/255.

target_num = []
for i in range(10):
    idxs = np.where(y == i)
    idx = np.squeeze(idxs)[0]
    target_num.append(idx)

loss_t = []

for num_label, idx in enumerate(target_num):
    fig, (ax1, ax2) = plt.subplots(ncols=2, figsize=(10,4))
    r = 3
    V = X[idx,:].reshape(28,28)
    (m,n) = V.shape[0:2]
    ax1.imshow(V)
    ax1.set_title('original')

    W = np.random.rand(m,r)
    H = np.random.rand(r,n)

    local_loss = []

    for i in range(50):
        H = H * ((W.T@V)/(W.T@W@H))
        H[np.isnan(H)] = 0.
        W = W *((V@H.T)/(W@H@H.T))
        W[np.isnan(W)] = 0.
        loss = np.linalg.norm(V - W@H, 'fro')
        local_loss.append(loss)
    loss_t.append(local_loss)
    ax2.imshow(W@H)
    ax2.set_title('loss: {}'.format(loss))
    fig.show()

plt.clf()

fig = plt.figure(figsize=(6,5))

for i, _loss in enumerate(loss_t):
    plt.plot(_loss, label=str(i))
plt.legend()
plt.show()